F1 simulation
“Simulating Formula 1 crashes in the start-section including the first turn”
Abstract – Crashes in Formula 1 are influenced by certain properties of circuits. A computer simulation model, based on the Nagel-Schreckenberg traffic model, is used to study the effects of acceleration, turn speed, distance and braking. The goal is to find unsafe conditions in a small part of a circuit. The results show that crashes are influenced by speed but that there is no significant factor that shows how or when a crash will happen.
|
|
GitHub repository
CS Course: Research Methods
A fellow student and I did this project together.
Formula 1 has a lot of unexpected events in it, which made it seem like the perfect research subject.
The research question
The question was whether properties of a circuit make the start of a race less safe. We only looked at the start section, from the grid up to and including the first turn. Nine of the first 16 races of 2017 had an incident there.
The FIA circuit rules say “There should preferably be at least 250 m between the start line and the first corner.” We tested that kind of rule with four variables: the distance from the start line to turn one, the braking distance, the turn speed and the acceleration.
From traffic model to race start
The Nagel-Schreckenberg traffic model has four steps per car: acceleration, slowing down, randomization and car motion. The original has a single lane and cars that can’t collide, so our model keeps the four steps but changes most of the rest.
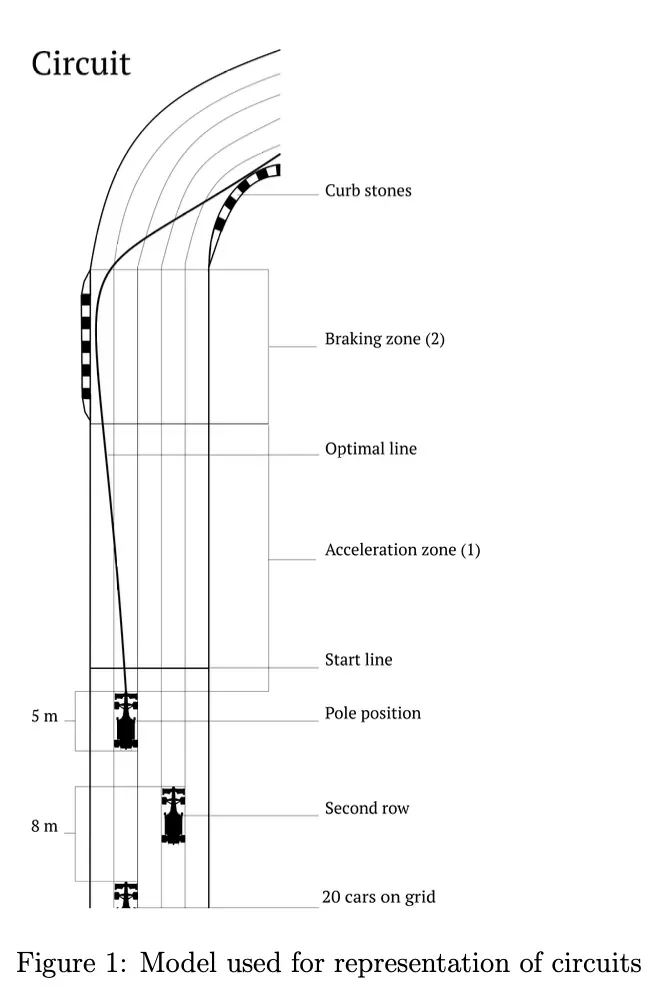
The track width is split into five rows, so a car can pass on both sides, and a car is 5 metres long and 2 metres wide. Twenty cars start on two sides, 8 metres apart and alternating from the pole position side, in an order sampled from the 16 qualifying results of 2017 so far.
A car accelerates until it reaches its braking point. The acceleration values come from the 0 to 100 km/h time of about 2.6 seconds and from times for a few specific cars, so a Ferrari gets 11.2 m/s² and a Toro Rosso 9.6 m/s². The braking follows from the current speed and the maximum speed of the turn, spread over the metres left until the turn.
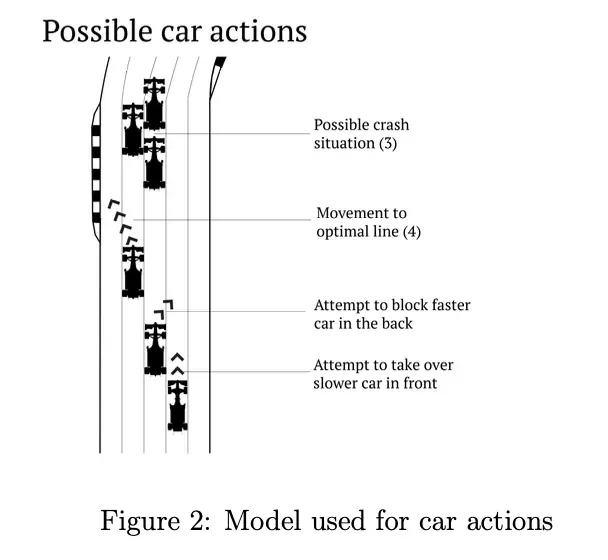
A faster car overtakes towards the optimal row, which we defined as the opposite side of the turn, and a car with a faster one behind it moves into that row to block it. If the move is blocked, the car stays in its row. One step is one second, and a run stops when the last car has passed the turn or at the first crash.
When is it a crash?
Crashes only happen between two cars in the same row, when the gap to the car in front drops below zero. The car first tries to switch rows, and if no row is free, the randomization step decides between braking and crashing with equal odds. From models/car.rb:
def crash_check
  return unless car_in_front && car_in_front.row == row # no car is blocking
  return if m <= (car_in_front.m - length) # there's still space
  return if m - length > car_in_front.m # take over
  return switch_rows? if space next_row # switching rows could prevent crashes

  if rng.rand(1.0) > 0.5
    @crash = true
    write_crash
  else
    @m -= 20
  end
end
Braking here means the car drops back 20 metres.
Simulation setup
We ran 10,000 Monte Carlo runs for each of the 20 circuits on the 2017 calendar. For every circuit, circuits.json holds the distance to turn one, the braking distance, the turn speed, the side of the turn and the pole position side.
The randomness comes from Ruby’s own generator, a modified Mersenne Twister. We tested it as if it were a die: 50,000 rolls gave a chi-square of 1.2834, well below the critical value of 11.07 (α = 0.05, 5 degrees of freedom), so we accepted the generator as fair.
Results
The 200,000 runs produced 121,747 crashes. Since a run stops at its first crash, each number below is the number of starts out of 10,000 that ended in a crash.
| Circuit | Start to turn 1 (m) | Braking (m) | Turn speed (km/h) | Crashes |
|---|---|---|---|---|
| UAE | 305 | 50 | 150 | 9449 |
| Malaysia | 620 | 100 | 74 | 8849 |
| Singapore | 274 | 50 | 126 | 8724 |
| USA | 364 | 100 | 86 | 8217 |
| Azerbaijan | 206 | 50 | 116 | 7926 |
| Australia | 381 | 100 | 150 | 7837 |
| Bahrain | 476.4 | 100 | 70 | 7792 |
| China | 324.7 | 50 | 170 | 7664 |
| Hungary | 576 | 100 | 85 | 7550 |
| Monaco | 111 | 75 | 103 | 7477 |
| Italy | 615 | 125 | 80 | 7393 |
| Spain | 690.5 | 100 | 130 | 7211 |
| Canada | 258 | 125 | 154 | 6334 |
| Mexico | 890 | 200 | 107 | 6279 |
| Brazil | 334 | 50 | 109 | 5129 |
| Belgium | 251 | 150 | 77 | 2887 |
| Russia | 205.2 | - | 300 | 2103 |
| Japan | 373 | 10 | 152 | 1262 |
| GBR | 270 | - | 281 | 991 |
| Austria | 318 | 200 | 122 | 673 |
This is the table from our paper, although the crash log and the plots in the paper use 25 m of braking for Monaco and 252 km/h for Japan.
Braking distance didn’t have a clear effect, its regression line against crashes is almost flat. A longer start straight gave more crashes, which could be because of the higher speed or simply because there are more metres to crash in. A faster first turn gave fewer crashes, since smaller speed differences mean fewer cars running into the back of each other under braking. And we found no hard correlation in the distances, so no hard safety reason for the FIA’s 250 metre preference either.
In the raw log, crashes-final.json, the peak is at second 11, with 40,115 of the 121,747 crashes. Overall the crashes in the model look random, and no single factor shows how or when a crash will happen.
Limitations
Five rows is wider than real turns, where 2 or 3 cars fit next to each other, and the width of the start straight also differs per circuit. The angle of a turn isn’t modelled, so turns that need hard braking are missed. Each car has a single linear acceleration value for the whole season, taken from the first 100 metres, while real acceleration drops as the speed goes up.
Only head-to-tail collisions exist, no side-to-side ones, and weather, the rules on defending a position and driver reaction time are left out. In the paper we suggested looking at all crashes on one circuit in depth, instead of comparing all circuits at once.
Another simulation from the same MSc is Estimating the Uithoflijn’s operational performance with simulation.
Disclaimer: The above content and related documentation, papers, essays, code and other references, were created during a course of the MSc Computing Science. No rights can be derived from the content. Much work has been done in collaboration with other students. If there is any reference to your person in any way that you would like to see removed or to be named (more) explicitly, at any time, please let me know.