Estimating the Uithoflijn’s operational performance with simulation
“Estimating the Uithoflijn’s operational performance with simulation”
Intro - The future holds a major development in public transport for Utrecht: the construction of the Uithoflijn. This is a tram line that will aim to aid the transportation of thousands of people from Utrecht Centraal to the Uithof, and vice versa, every day. This is no small task, as the prognosis of number of passengers entering the tram both ways each day is around twenty-two thousand. Before the Uithoflijn is put into operation, it might be wise to perform a simulation to see if it is up to the task.
|
|
|
Paper on request.
GitHub repository
CS Course: Algorithms for decision support
The question
The Uithoflijn runs between Centraal Station and P+R De Uithof in Utrecht. A fellow student and I built a discrete-event simulation in C# to find out whether a timetable on that line stays on time with a full day of passengers, and how long those passengers end up waiting.
The line in the model
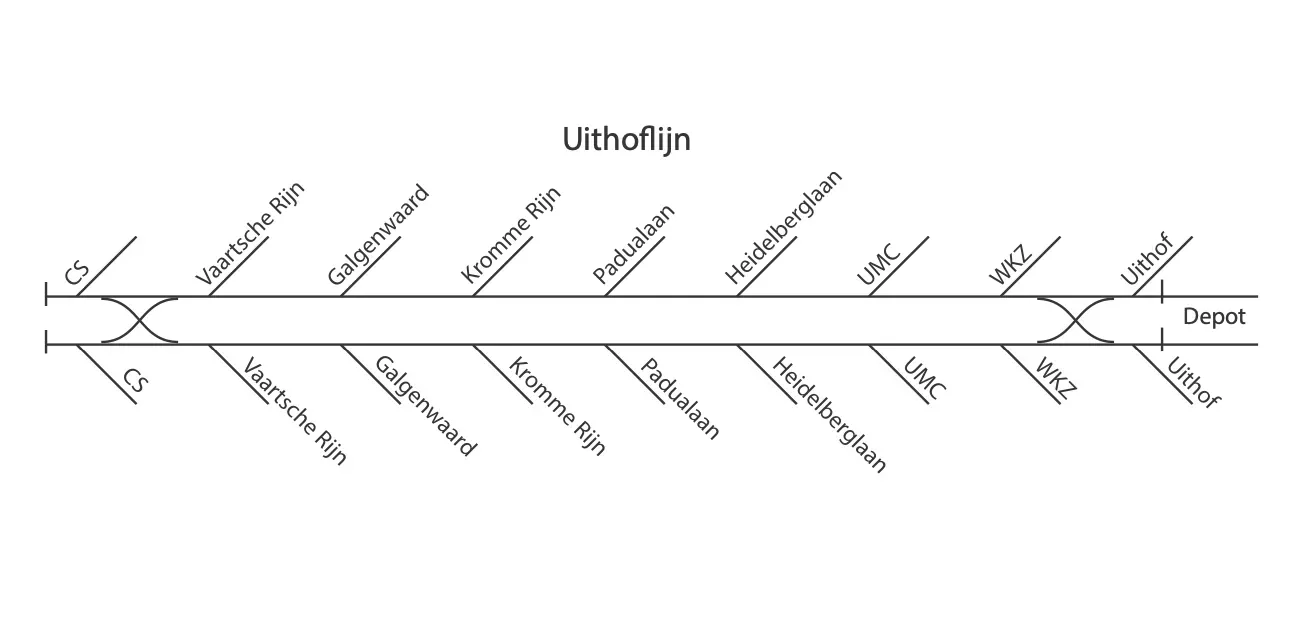
Uithoflijn.cs builds nine stops with a platform for each direction, so 18 Station objects plus a depot. The stops are P+R De Uithof, WKZ, UMC, Heidelberglaan, Padualaan, Kromme Rijn, Galgenwaard, Vaartsche Rijn and Centraal Station.
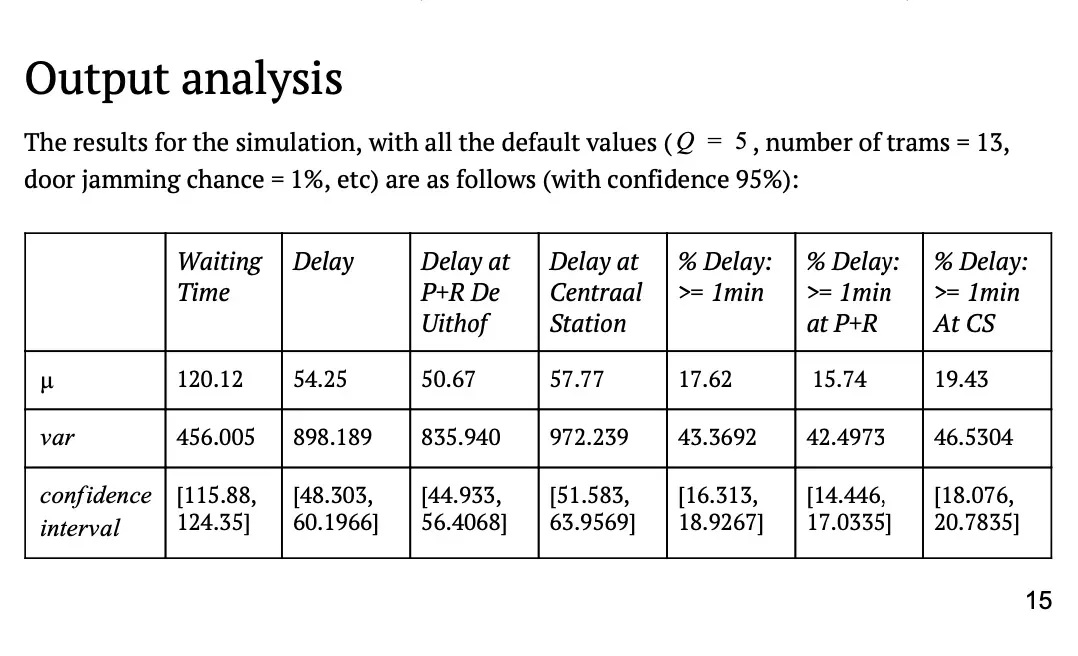
The model runs 13 double trams, out of 27 vehicles with 1 on stand-by, and a tram holds at most 420 passengers (Tram.PassengersIn). A tram can only enter a platform when it’s empty and the previous tram left more than 40 seconds ago, otherwise StationCheck tries again 10 seconds later.
Switching at the end stations
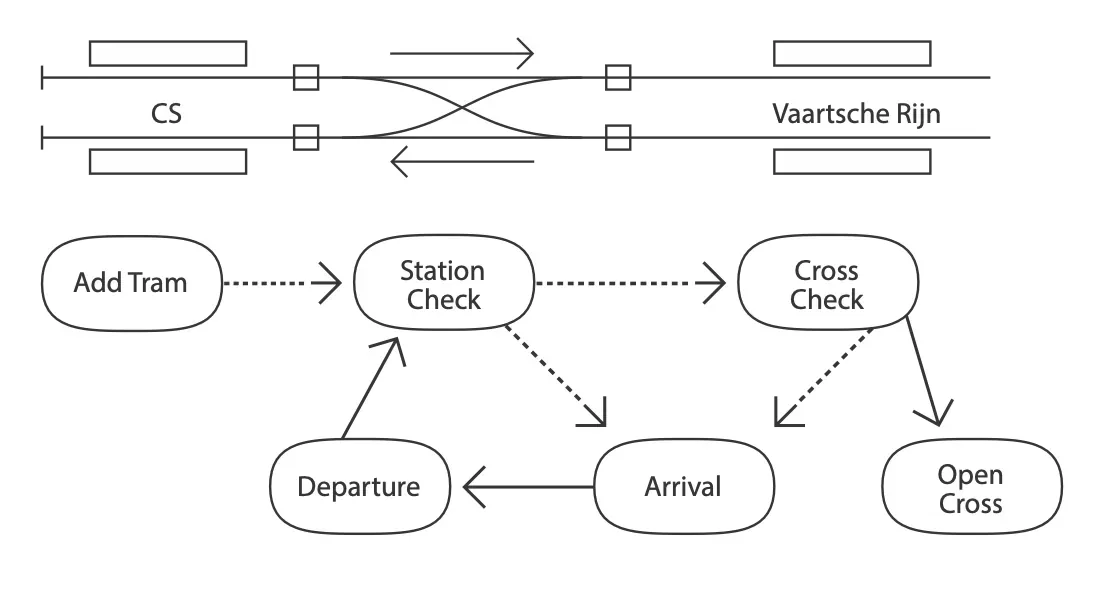
Both end stations have two platforms and a single switch (Cross.cs). A tram goes to the first platform, or crosses over to the second one when the first is taken, and a tram on the first platform crosses when it leaves. Every time a tram passes, the switch is closed for 60 seconds (OpenCrossAfterS), and a waiting tram checks it again every 2 seconds.
Timetable
The day runs from 06:00 to 21:30 (Program.cs). At 06:00 one tram starts at each end station, a second pair follows at 06:15, and from 07:00 the other nine trams enter the line at P+R De Uithof, 200 seconds apart.
At every end station a tram’s next scheduled departure moves forward by its schedule, which is 30 minutes before 07:00 and after 19:00, and 17 + Q minutes in between, with Q = 5 (MaxFSchedule). A tram stays at an end station for at least 180 seconds (MinQ in Arrival.cs), after which an early tram waits for its scheduled time and a late one just leaves.
After 19:00 trams leave the line at P+R De Uithof for the depot, at most one every 10 minutes, until nine of them are in.
Passengers, run times and dwell times
All random numbers come from Probabilities.cs, which uses a Mersenne Twister with seed 12 from MathNet.Numerics.
Passenger arrivals are based on rates_a.csv (towards Centraal Station) and rates_b.csv (towards P+R De Uithof), which hold an arrival rate per second for every stop and every quarter of an hour, 62 slots from 06:00. Passengers arrive as a Poisson process with those rates, and each one gets a timestamp so the waiting time can be measured.
exit_rates_a.csv and exit_rates_b.csv give the share of passengers on board who get off at a stop, again per quarter of an hour, with normal noise added at a standard deviation of 6.756% of the mean. At the last stop everyone gets off.
The time between two stops is log-normal around a fixed value per segment, from 59 to 243 seconds (Runtimes_a, Runtimes_b). The time a tram stands at a stop follows a gamma distribution with a mean of 12.5 + 0.22 × boarding + 0.13 × alighting seconds, with a floor at 80% of that mean. There’s a 1% chance the doors jam, which adds 60 seconds, and passengers who arrive while the tram is standing there board too, at 0.22 seconds each on average.
The event loop
Program.cs keeps a list of Event objects, each with a time, a type, a tram and a station. It sorts the list, moves the clock to the earliest event and lets Uithoflijn.Update handle it, which in turn schedules new events:
while (endCondition == false) {
  events          = events.OrderBy(e => e.DateTime).ToList();
  Event nextEvent = timingRoutine(uithoflijn, events);
  events          = eventRoutine(uithoflijn, nextEvent, events);

  // Check if End Condition is reached.
  if (!events.Any() || uithoflijn.SimulationClock > EndDateTime) {
    endCondition = true;
  };
}
There are six event types: departure, arrival, station check, add tram, cross check and reopen cross.
What it measures
Statistics.cs keeps track of the waiting time per passenger, from arriving at the stop until boarding (average and maximum), the delay at every end-station departure (for both ends together and for each end on its own), and the share of end-station departures that are at least one minute late. Each of those exists for the whole day, for the maximum frequency period from 07:00 to 19:00, and for the morning rush from 07:00 to 09:00 and the evening rush from 16:00 to 18:00.
The project targets .NET Core 2.0. It does 100 runs and prints one semicolon-separated line per run, so the output goes into a CSV file:
dotnet run > output.csvWith NumberOfRuns set to 1 in Program.cs you get a readable summary instead.
Results on artificial input
We also ran the model on seven artificial input files, input-data-passengers-01.csv up to input-data-passengers-06.csv, with passengers boarding and leaving per stop, direction and time block. We did 100 runs per file, and the output is in the data folder. For the three heaviest files the averages were:
| Input file | Boardings in file | Average wait | Average delay | Departures 1+ min late |
|---|---|---|---|---|
input-data-passengers-03.csv | 153,800 | 221.42 s | 288.58 s | 67.68% |
input-data-passengers-04.csv | 175,800 | 813.32 s | 346.61 s | 73.57% |
input-data-passengers-06.csv | 190,400 | 1659.32 s | 355.19 s | 74.75% |
For the four lighter files the average wait stays between 109.97 and 239.15 seconds, the average delay between 48.71 and 129.45 seconds, and between 16.65% and 40.74% of departures are at least a minute late. With 190,400 boardings the average wait goes up to 1659.32 seconds, which is close to 28 minutes.
We built it in 98 commits between 20 September and 24 October 2018.
Another simulation on this site is the F1 simulation, a Monte Carlo model of Formula 1 starts in Ruby.
Disclaimer: The above content and related documentation, papers, essays, code and other references, were created during a course of the MSc Computing Science. No rights can be derived from the content. Much work has been done in collaboration with other students. If there is any reference to your person in any way that you would like to see removed or to be named (more) explicitly, at any time, please let me know.